In mathematics, parametric equations describe a pair of quantities as explicit functions of independent variables regarded as “parameters.” They are most commonly used to define the coordinates of points that comprise a geometric artifact such as a curve or surface, in which case the equations are referred to as a “parametric representation” or “parameterization of an object.” In this article, we will learn to graph plane curves and eliminate the parameter.
Although, before all else, we will consider the empirical use of parametric equations in order to gain a conceptual understanding of it outside of purely abstract notions.
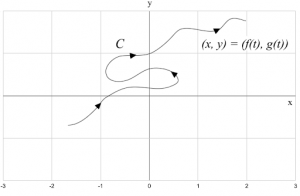
Imagine a particle moving along a curve C, shown below.

It is virtually impossible to describe C with an equation in the form of y = f(x). This is because it fails the Vertical Line Test, which allows us to determine whether a curve in a graph represents a function. However, the x and y coordinates of the particle are considered functions of time. Therefore, we can consider it as x = f(t) and y = g(t). This should give you a practical idea of our topic of discussion.
Graphing plane curves
Graphing a plane curve involves plotting points in the rectangular coordinate system and connecting them with a smooth curve. To do this, we need to select values for t on a given interval, use the given parametric equations to calculate x and y for each value of t, and plot (x, y) in increasing order, as well as connect them with the smooth curve.
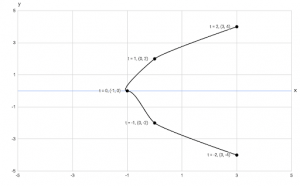
Example: Graph the plane curve defined by the parametric equations x = t² – 1, y = 2t, and -2 ≤ t ≤ 2.
Step 1. Select values from the given interval. We will now choose integral values of t on the interval -2 ≤ t ≤ 2. Let t = -2, -1, 0, 1, and 2.
Step 2. For each value of t, use the listed parametric equations to calculate x and y. This is demonstrated by the table below, where the first column details the choices for parameter t, the following two columns depict the values for x and y, and the last column delineates the ordered pair (x, y).

Step 3. Plot the points (x, y) in order of increasing t and adjoin them with a smooth curve. The plane curve defined by the parametric equations on the interval is loosely represented below.

Note: The line is meant to be smoothed.
Eliminating the parameter
The aforementioned graph shows x = t² – 1, y = 2t, -2 ≤ t ≤ 2. Even if we carefully scrutinize the equations, we may not be able to identify that a corresponding plane curve is a section of the parabola. By removing the parameter, we can create an equation that is equivalent to the parametric equations. To do this, we need to solve one equation for parameter t and substitute the value in the second equation.
Example: x = t² – 1 and y = 2t.
Step 1. Solve for parameter t.
Solving for y = 2t, we get a result of t = y/2.
Step 2. Substitute for t.
Using the value t = y/2 and the equation x = t² – 1, we substitute. Therefore, we end up with x = (y/2)² – 1.
In conclusion, we have just learned how to graph and eliminate parametric equations. A comprehensive approach to the subject will prove itself particularly relevant in a calculus class, more specifically, in an AP Calculus BC course.
Written By: Estefania Olaiz
Date: February 28, 2022
Sources:
1. https://www.britannica.com/science/parametric-equation
2. https://en.wikipedia.org/wiki/Parametric_equation
3. https://tutorial.math.lamar.edu/classes/calcii/parametriceqn.aspx
4. http://rfrith.uaa.alaska.edu/M201/Chapter10/Chap10_Sec1.pdf
5. https://fl01000126.schoolwires.net/cms/lib/FL01000126/Centricity/Domain/261/Ch9_Section5.pdf
